Filter data
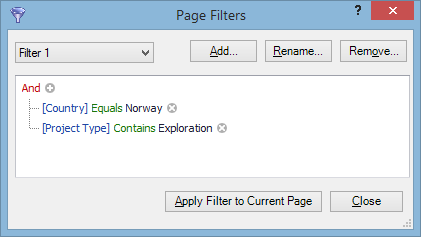
Page Filters is used to set up filters, and is available on visualization pages, the pivot grid and data series in charts. Depending on where you open it, it will have a different number of options: for example, multiple filters are available for pages but only one filter can be applied to the pivot grid. To open, click on Manage Filters in the drop-down box underneath Filter.
Note: Page-level filters using properties are not available for snapshot charts.

Example: In the image above, the filter will display projects which are located in Norway and belong to an exploration project type.
Logical operators are shown in red (for the list of operators, see the table below). Parameters on which the selection is based are shown in blue. Criteria operators are shown in green. Values are shown in black; you can type a value or select an existing value from the list.
| Operator | Description |
|---|---|
| AND | Projects must satisfy all conditions specified under the operator. |
| OR | Projects must satisfy any of the conditions specified under the operator. |
| Not AND |
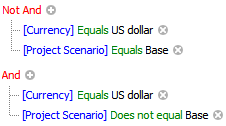
This operator works the same as AND with a negative condition. We recommend using the AND operator for simplicity. For example, two filters shown below will produce identical results.
|
| Not OR | This operator works the same as OR with a negative condition; see the Not AND example above. We recommend using the OR operator for simplicity. |
To add a new condition, click on 

You can also add groups of conditions. To add a group, click on the logical operator which will be the group's parent and select Add Group. To remove a group, click on its logical operator and select Remove Group.
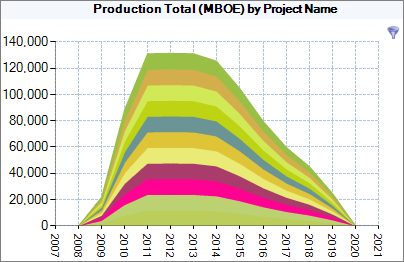
If a filter has been applied to a data series, the filter icon  will be displayed in the top right corner of the chart as shown below. If the chart title is displayed, you can view filtering conditions on the chart: right-click on the chart and select View > Filter Details.

